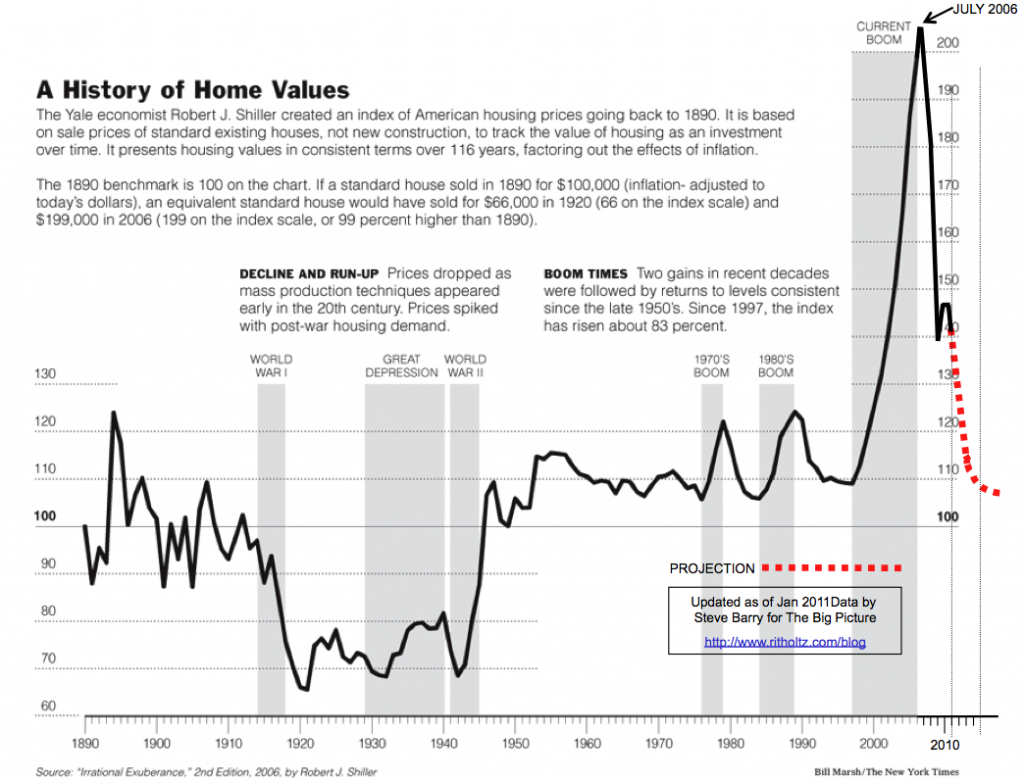
Here’s an updated chart of how home values have changed throughout the last century along with the burst of the 2006 housing bubble. Interesting how we’re currently back to the prices equivalent to World War II.
Contributor, designer & admin for JohnHart Gazette.

