Now these are some numbers that look familiar. The housing market has spent a couple of months in the wake of the holidays stretching out of hibernation. But March’s nearly straight run of surges brings us back to very familiar territory. Maybe painfully familiar for buyers. It was a month that saw neighborhoods surging further into the seller’s favor in all except two circumstances. And while those two drops were modest, they were also in neighborhoods you wouldn’t necessarily suspect. So, even when the housing market is returning to familiar ground, it’s doing so in an unpredictable way. Gotta love it. So grip that saddle and pull yourself up on March’s mechanical bull… err, absorption rate analysis.
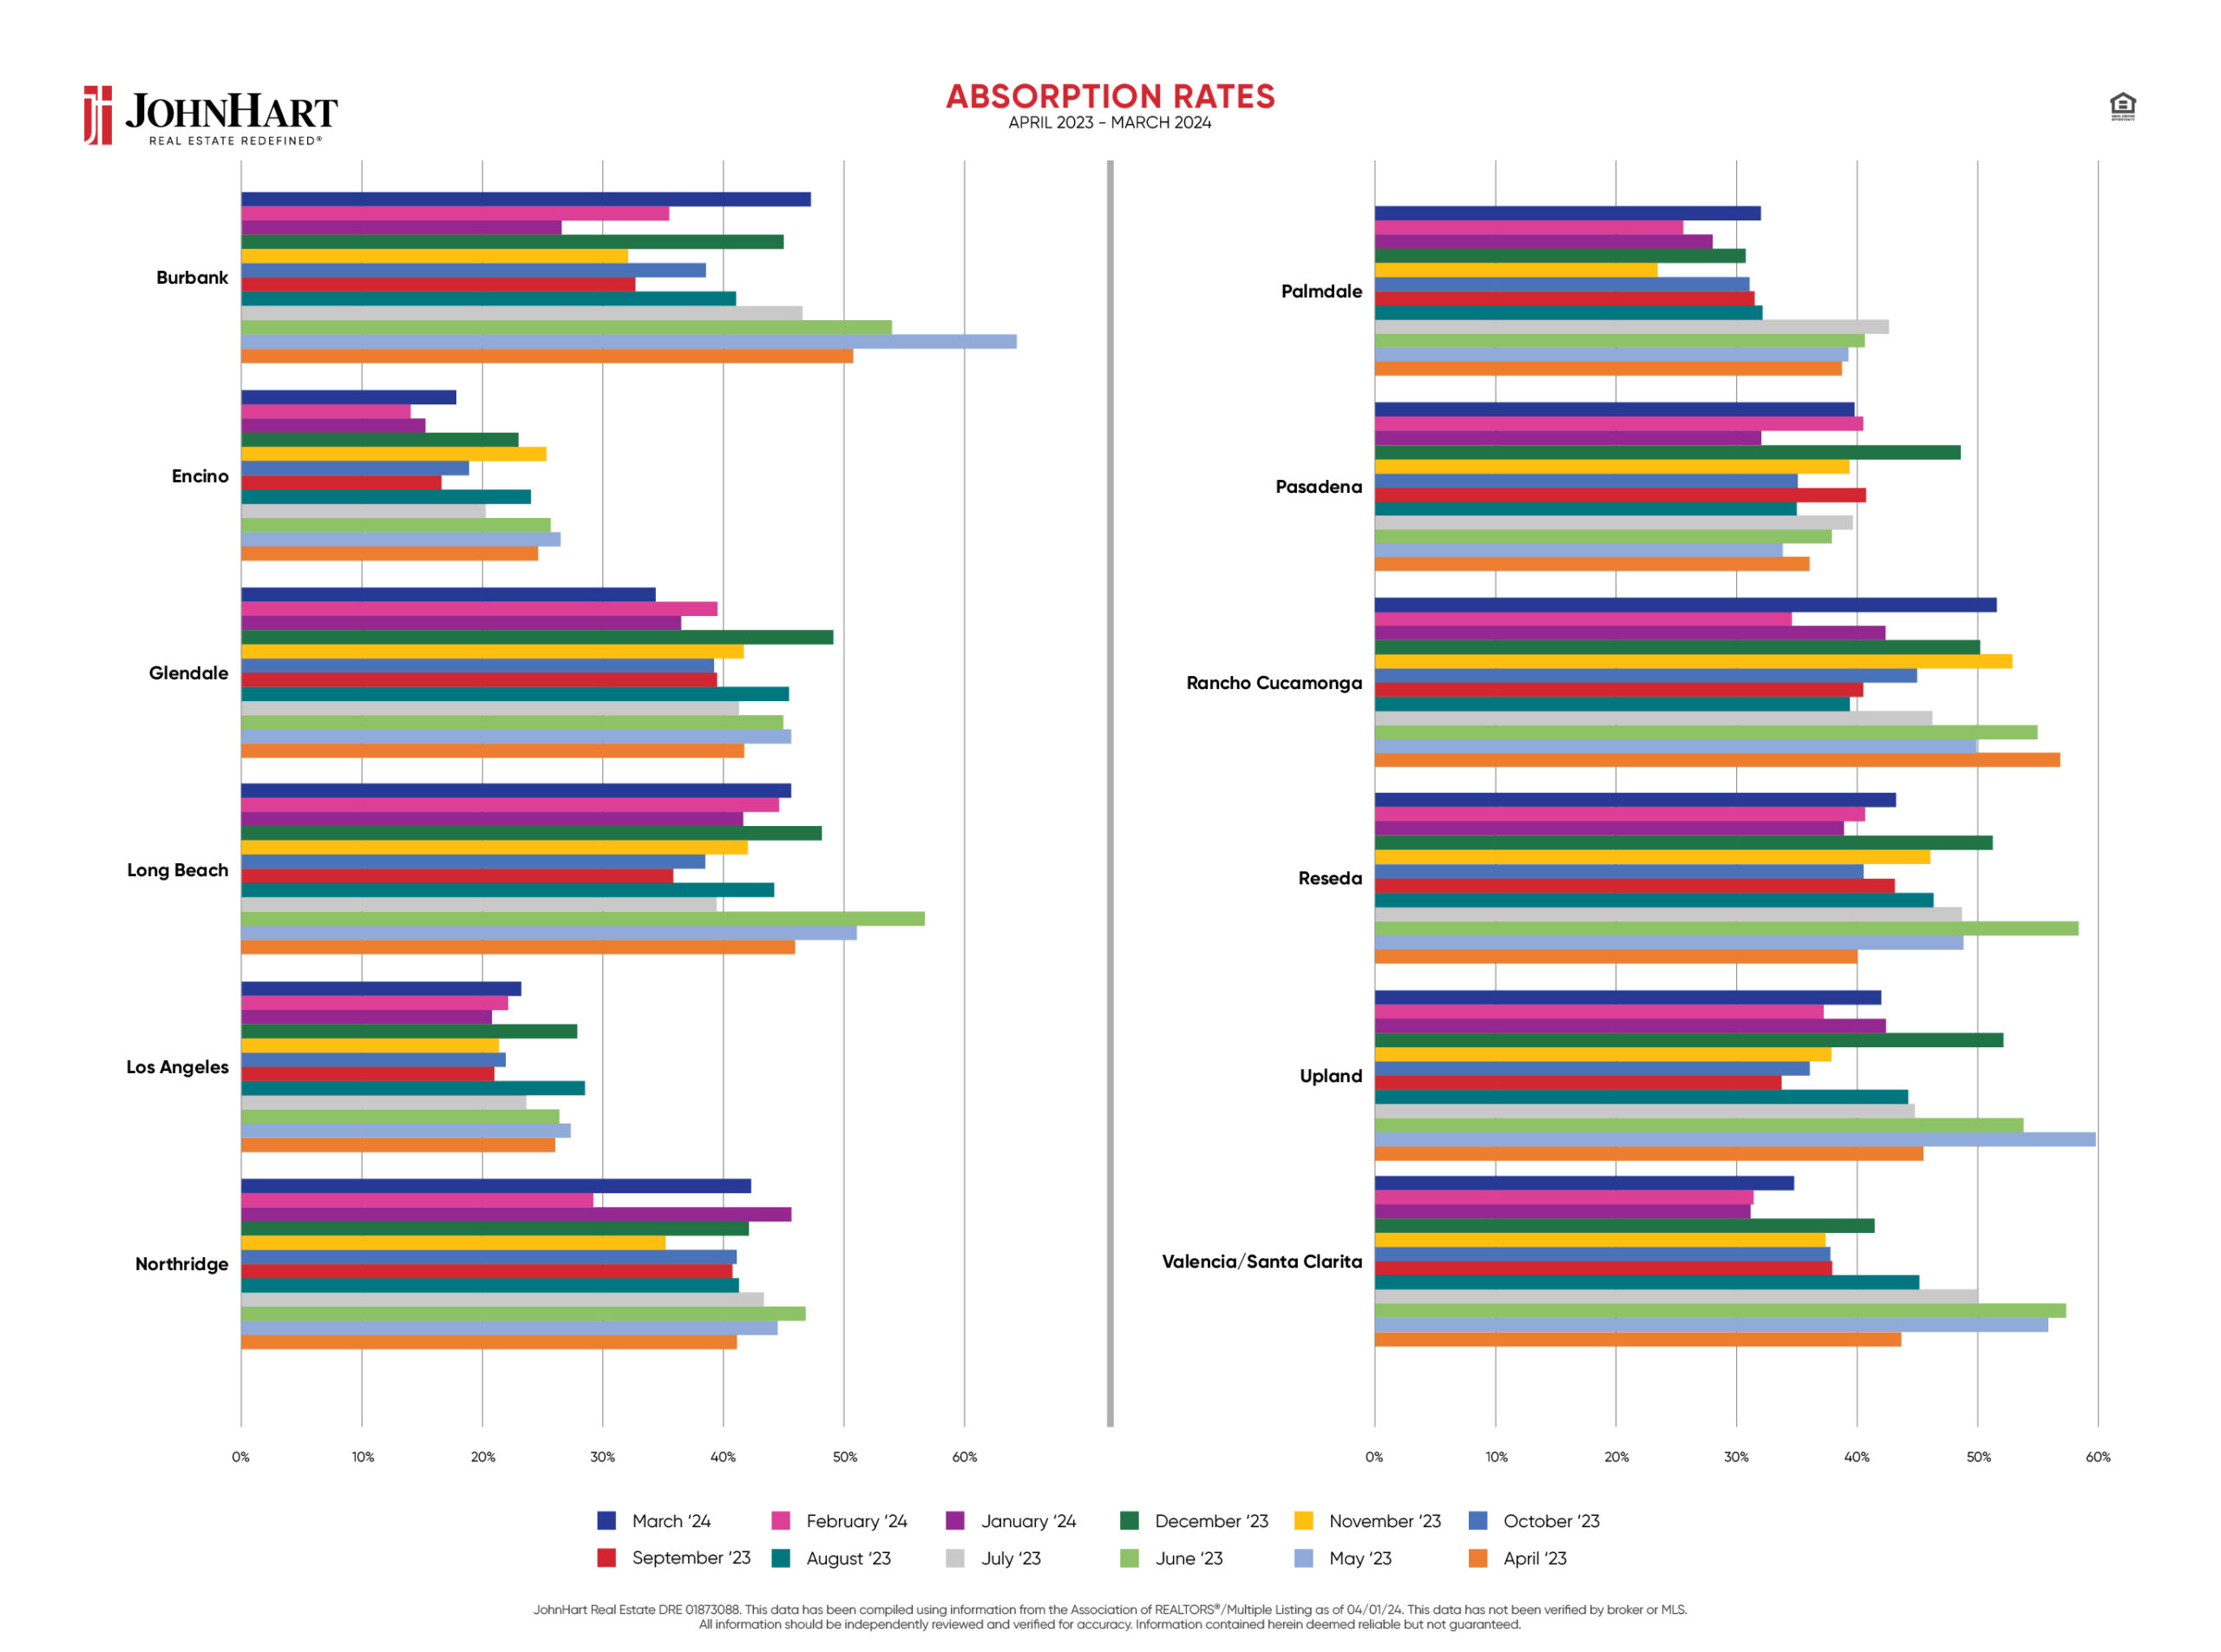
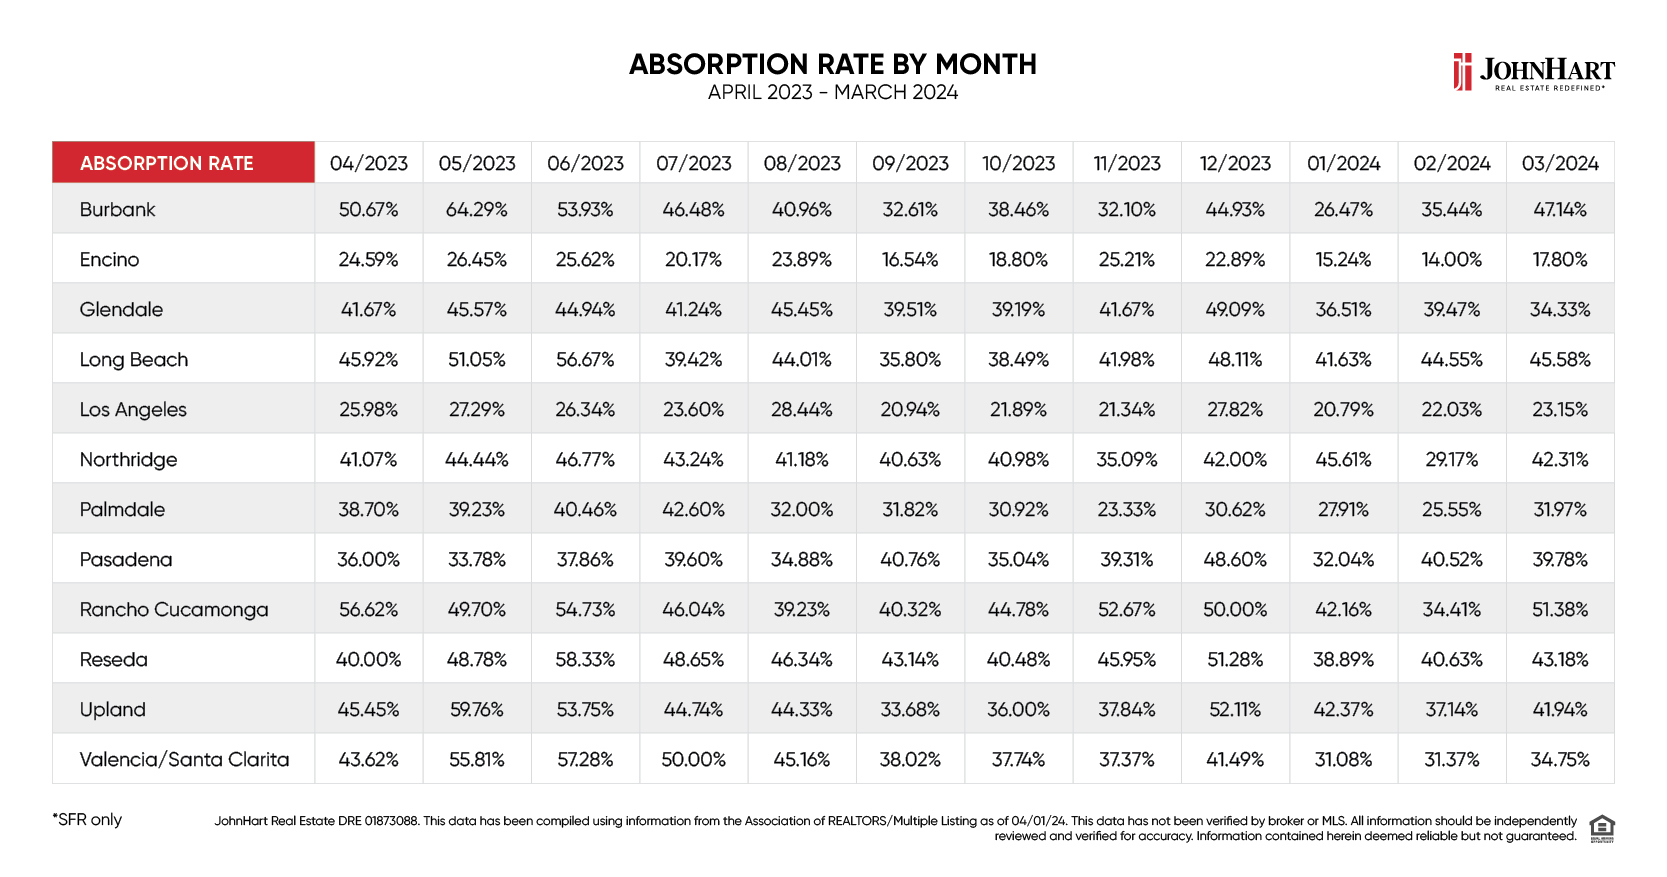
Absorption Rates – March 2024
- Burbank – 47%
- Encino – 18%
- Glendale – 34%
- Long Beach – 46%
- Los Angeles – 23%
- Northridge – 42%
- Palmdale – 32%
- Pasadena – 40%
- Rancho Cucamonga – 51%
- Reseda – 43%
- Upland – 42%
- Valencia/Santa Clarita – 35%
Absorption Rate FAQs
What is an absorption rate?
An absorption rate is a statistic we use in the real estate industry to gauge whether the market in a given neighborhood generally favors a homebuyer or seller. Universally speaking, absorption rates of 20% or higher favor the seller, indicating what we call a seller’s market. Absorption rates of 15% or lower would indicate a buyer’s market. But, as we explored in our very first Absorption Rate Analysis blog, these numbers are guides, not rules. And there are always exceptions proving the rule… errr, guide.
Why not include townhouses and condos in your calculations?
If you heard that JohnHart Real Estate only factors single-family homes into our absorption rate calculations, you heard right. But why not include sales that could make us look better? Because our clients are overwhelmingly interested in single-family homes. We didn’t want to skew the numbers in our favor. We wanted to give our clients an accurate market assessment, based on their interests.
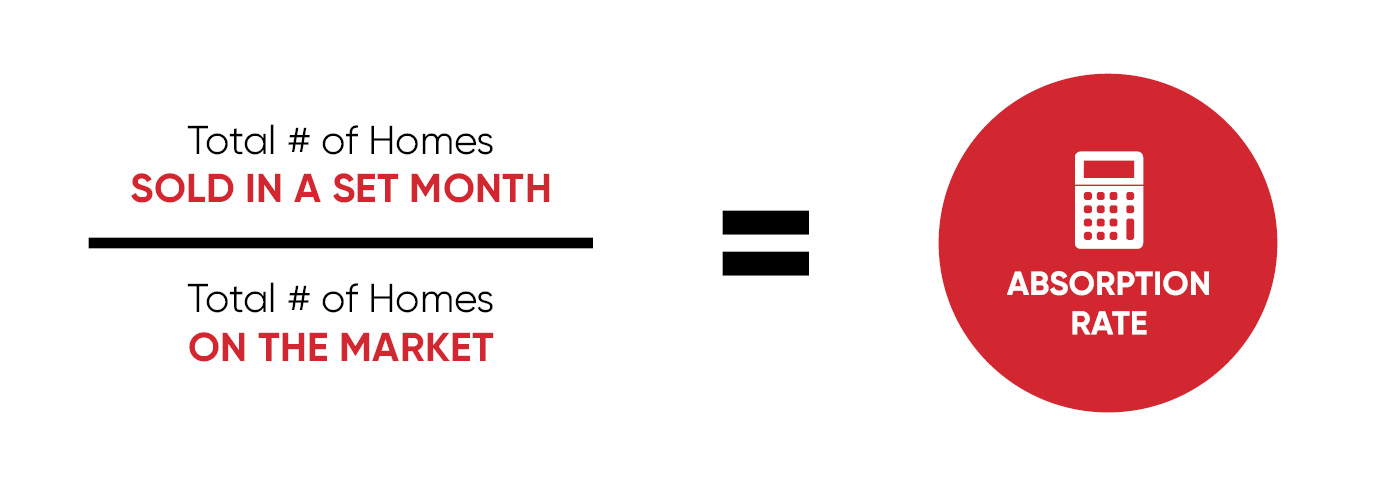
How is an absorption rate calculated?
We use this basic universally accepted formula:
Surge Spelunking Through March’s Absorption Rates
Now let’s dive into March’s absorption rates… or should we say “start climbing”? Because, with the exception of two neighborhoods, all of the areas included in our analysis surged upward into the seller’s favor. Further into the seller’s favor, actually. After all, the only neighborhood that remains remotely close to a universally-accepted buyer’s market is Encino.
Rising Rates in Rancho
If you’re on the fence about selling your home in Rancho Cucamonga, March was all about you. The San Bernardino County community shot upwards with a 17% swell. To be fair, this follows three consecutive months of drops for Rancho Cucamonga.
But the community nearly regained all that lost ground in a single month. Clocking a massive 51%, the highest absorption rate for March, it’s safe to say that this neighborhood is smiling on its sellers. So, if you were considering a sale in Rancho Cucamonga, the water is officially warm enough.
Other Major Markets for Sellers

We’d be remiss if we didn’t mention the ample absorption rate gains in both Northridge and Burbank. Northridge pogoed 13 percentage points for a 42% absorption rate while Burbank jumped 12 percentage points for a 47% absorption rate. Neither is exactly a surprise.
These neighborhoods appear happily at home deep in the seller’s market. But Burbank has been dropping more than rising over the last several months. And Northridge has almost been predictable in its recent unpredictability. Could things be returning to some state of normalcy?
Buyers Still Love Encino
But where can buyers go to get a break? Unsurprisingly, Encino. The valley community has historically spent its days closer to the buyer’s market than our other neighborhoods… when not camped out right in it. In March, Encino actually climbed 4 percentage points, landing it at an 18% absorption rate in that odd twilight zone between the defined buyer’s and seller’s markets. It’s still the lowest absorption rate for the month.
Modest Drops in Unexpected Places

The biggest drop in March was a mere 5 percentage points. But where it happened is more of a surprise. Glendale, easily one of our most competitive neighborhoods for buyers, went against the grain, dropping down to a 34% absorption rate. In a community that has practically lived above the 40% mark, it’s a touch of relief for the long line of prospective Glendale homebuyers.
The only other neighborhood to manage a drop toward the buyer’s favor was Pasadena. But don’t get too excited – it was just a single percentage point for an overall absorption rate of 40%. A far cry from January’s 17 percentage point drop! Pasadena is another highly competitive neighborhood for buyers, so even a modest slip toward the buyer’s market is noteworthy.
All Eyes on April
Could the seller’s market be returning with the surges we’ve come to expect? Or is 2024 a gentler year? After all, anyone following us for over a year will remember last March when every single neighborhood on which we report rocketed further into the seller’s market. This March, buyers got 6 percentage points of sweet relief. In April 2023, we saw most neighborhoods slingshot back toward the buyer’s favor. Will it happen again? Stay tuned!

After working with, and for, many different real estate firms, it became apparent to Harout that there was a major disconnect between what consumers needed/wanted and the service that was being provided to them. It was upon this realization that Harout founded and opened JohnHart Real Estate; and as the CEO/Principal Broker he has continued to break from the norm and redefine real estate with an insatiable appetite to give his clients the service and attention they deserve.