
What does all of this mean for the CA Real Estate Market?
Thanks to our friends over at Foreclosure Radar, we have exclusive access to what is happening in the California real estate market. As a professional in this industry I owe it to all of my clients to make sure that I am up-to-date with every change in the market. Whether it is one of my many short sale clients or one of my property investors, I need to know how to protect them, and how to guide them. Through this article I hope to share some insight with all of you!
One of my favorite things to do is to review data from various sources, and look for trends to form my own conclusions about where I believe the market is headed.
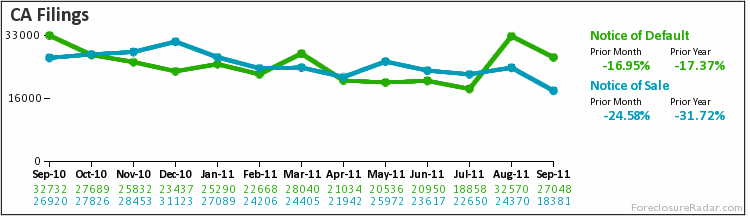
Lets take a look at a few charts that I find particularly useful, starting with the one above /\.
In the “CA Filings” chart we can see the number of Notice of Default’s filed, and the number of Notice of Trustee’s Sale filed, across California for the the past year. Right off the bat you can see that these two markers are correlated rather closely. This is explained simply by the fact that most people who receive an NOD (notice of default) do not end up curing it, and consequently receive an NOT (notice of trustee’s sale) shortly thereafter. Aside from that we can also see the number of both has dropped rather severely as of late, and has had an overall decline year over year; both of which are positive signs for the market as a whole.
The next chart that I like to examine is the outcomes of foreclosure chart, below \/

In this chart we can see not only the three main outcomes of foreclosure, but the approximate number month by month of each outcome. Unfortunately this chart isn’t as positive as the previous one! What we can see is that while cancellations of foreclosure came down, both sold back to bank and sold to 3rd party numbers increased. Even worse is that the latter two indicators increased by more than the amount that the cancellations decreased, so this was not just an offsetting!
By comparing the first two charts we are able to see that they are very closely related; however we must keep in mind that the second chart is a trailing indicator of what happened in the first chart. Taking all things into consideration we can see that while foreclosure filings are decreasing over time, so are cancellations of foreclosure. Essentially we are seeing less foreclosures initiated, but at the same time we are seeing more foreclosures actually go all the way through to the sale of the property. As the old adage goes: you have to take the good with the bad!
This last chart I wanted to share as I find it particularly interesting/amusing.

This chart is showing us that the banks have a consistently inflated idea of what the value is for the properties they are foreclosing on! This is easily deduced by looking at the published bid amount (which the bank sets) versus the winning bid amount (what someone actually paid for it at the auction). Furthermore if you look at last years numbers you can see that they are actually getting worse at pricing these assets, as their published bid amount have increased year over year, while the winning bid amount has decreased year over year! I personally find this hilarious, as it is no wonder why these banks are so eager to foreclose on their properties: They think they are worth a lot more than they actually are!!
I guess the banks haven’t realized that their assets aren’t worth what they used to be! Or… are they just trying to bolster their portfolio with artificially inflated values to make their books look a little better?? It wouldn’t be the first time that the banks tricked someone 😉
Let us know what you think below, and have a great day!
After working with, and for, many different real estate firms, it became apparent to Harout that there was a major disconnect between what consumers needed/wanted and the service that was being provided to them. It was upon this realization that Harout founded and opened JohnHart Real Estate; and as the CEO/Principal Broker he has continued to break from the norm and redefine real estate with an insatiable appetite to give his clients the service and attention they deserve.