The month of July finished off with some slightly lackluster statistics, surprisingly not only in the condo/townhouse market but also in the Single Family Residence (SFR) market as well. After what can only be described as a two-year crush in SFR listing inventory in Los Angeles County, it appears that we could be starting to see supply creep back into the market. Before we dive into the SFR August housing market update, let’s take a look at condominiums, which have been struggling to make a comeback since the start of the pandemic.
The Condo Market Update
In May of 2018, there were approximately 1.5 Months of Inventory (MOI) in the condo market, meaning that if no new listings came on the market it would take 1.5 months to sell all the listings on the market at the current rate at which properties were selling. That’s a good healthy clip for our condo market. In May of 2019, the MOI was at 2.2, still pretty healthy. May of 2020 we were at 4.6 MOI – with only 479 condos sold and 2,222 condos sitting on the market. In 2020 we also saw the median sold price for a condo drop from $535k in March to $490k in May. The market was stagnant, and anything actively listed was getting slashed and sold on sale.
As people ran from the city in a panic over the pandemic, we saw the number of actively listed condos rise from 1,597 listings in March of 2020 to 2,958 listings in October. However, the woes were not for long. As peoples’ fears began to diminish we experienced a bit of a “draining of the swamp”. From October 2020 until April 2021 we saw inventory fall back down to earth at 1,983 condos actively listed in Los Angeles with an MOI of 1.3! Over the same time period, we also saw the median sale price rose from $525k to $575k.
Is the Condo Market Changing?
In the past three months, we have seen what may be the start of the condo market either normalizing or potentially correcting from a slight run-up following the massive sale in the second half of 2020. We have seen a small but consistent uptick in inventory from April through July without much movement in the number of condos sold.
In July specifically, we saw an increase in for-sale inventory of 8.4% and a decrease in sold condos of 3% compared to June. These are not large changes, but when you add in the average days on market (to sell a property) is even from June- despite having consistently dropped for the past 6 months- and the median sold price dropped for the first time in 6 months. Also, the MOI seems to be creeping back up ever so slightly. Therefore, I think there is a case to be made that the market is settling back into its normal ebb and flow as inventory comes on and sells off at a more normal pace. I don’t see anything that indicates a large correction or crash coming, and I don’t think the Delta variant is scary enough to push us back into a whirlwind of panic, but I do think things may slow down a bit in the condo market.
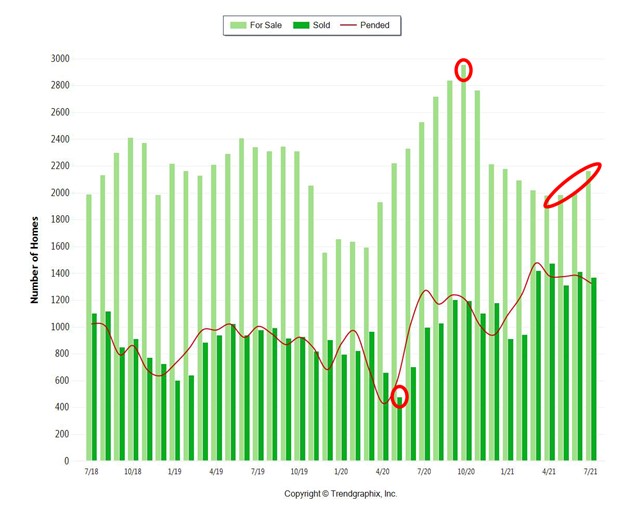
Below is a graph of the condo market’s for sale, sold, and pending inventory levels over the past three years. I’ve circled three specific moments of interest. The first being the lowest number of condos sold in a month going back 15 years – this includes the bubble burst in ‘07/’08/’09! The second is the greatest number of condos for sale in a month going back 9 years – only beat by the inventory coming off of the bubble burst in 2006-2011. The third is the slight run-up inventory we are starting to see.
The Single Family Residence Market Update
Now, the moment most of you have been waiting for: the Single Family Residence market. We’ve all seen the memes. The Los Angeles SFR market has literally been a joke since December 2020. Sure, the LA housing market is generally one of the hottest in the country, but in November of 2020 we had 6,341 homes for sale and 4,191 homes sold and in December 2020 we had 4,758 for sale and 4,865 homes sold. Yes, those numbers are correct. We have hovered around one month of inventory since then. We didn’t break 5,000 homes for sale again until June. July, however, is starting to set the tone for a steady several-month increase in for-sale inventory, and a slight pullback in sold properties.
Relative to June, in July we saw an increase in actively listed properties of 9.3% and a decrease in sold properties of 6.3%. We also saw the first decrease in median sold price since January, we were even on average days on market (the first time it hasn’t decreased since January), and we had a slight increase in MOI.
In LA, we all know that supply controls the housing market. Demand is always present, scarcity from lack of supply/inventory is what pushes prices up. If we continue to see inventory return to the August housing market we could see a slight correction on home prices in LA. But will it be meaningful? Doubtful. We would need to see a major increase, or a few months of consistent 10% increases, in inventory to really push prices down considerably. My advice to homeowners? If you’re thinking about selling – sell now before your neighbor beats you to it!
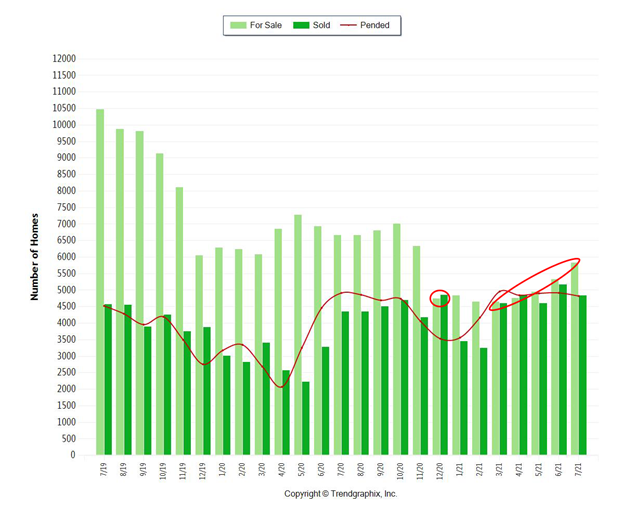
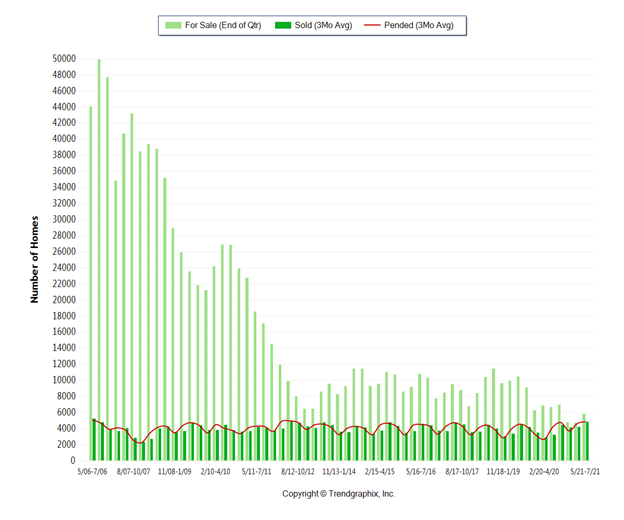
Below are two graphs for reference. The first graph has two points circled – the first point is December when sold properties outnumbered for sale properties, the second is the upward trend in inventory. The second graph is just a beautiful illustration of the absolute crush in SFR inventory in Los Angeles over the last 15 years.
What to Expect for August Housing Market
All-in-all I expect a tepid August without much movement up or down, my recommendation to Realtors is to price conservatively. The “free radicals” out there that could throw a wrench in things are another lockdown, Fed rates increasing, and/or rising inflation.
What do you think about the state of the August housing market? What are your predictions? Let us know in the comments! If you’re ready to jump in on this hot market, here is a list of all available properties right now.
*Information based on data from the Multiple Listings Service as of 8/13/2021
Want to get more content like this delivered directly to your inbox?
Of course, you do!
Enter your email address below to stay in the know.