
Those of us old enough to remember the bubble burst of 2007/2008, do not reflect on it fondly. Homeowners saw over a decade of equity eviscerated (figuratively) overnight. I’m not going to go into the causes of the housing bubble, and I’m not going to tell you how to avoid it because that’s up to the policy makers, but I am going to teach you about what I like to call “The Magic Metric.” It’s the one metric that I always keep an eye on because with just this one figure you can easily gauge the overall health of the housing market.
So what is The Magic Metric? It is what’s referred to as Months Inventory. The Months Inventory metric is a figure that tells you how many months it would take to sell off the current inventory of properties on the market based on the number of sold properties over the same time period.
For example, let’s say that in August there were 300 Active listings and 150 sold, the months inventory metric would be 2. 300 actives divided by 150 solds = 2. So in that scenario, if no new listings came on the market and demand remained the same it would take 2 months to sell off the inventory on the market.
Why is this Metric so Magical you ask? Because when you compare it month-over-month and year-over-year you can very quickly get a read on how balanced Supply and Demand are. Since demand is relatively high and steadily increasing in Southern California, it’s pretty safe to assume that when this metric moves it is usually Supply related. If it increases, new listings are outpacing sales and there is a surplus which will push prices down, and when it decreases generally it means that inventory is scarce which will push prices up. Now I know all the home schooled data scientists out there are itching to poke a hole in this theory, but we’re talking about broad strokes here, no need to get worked up little buddy.
I’m not telling anyone to buy or sell based on this metric alone, I am simply saying when you see it move you should look closer and ask “WHY?” Prices are subject to outliers because they are based on values; Months Inventory is based on volume and moves because of momentum – for that reason I find it to be a great indicator of something happening in the market.
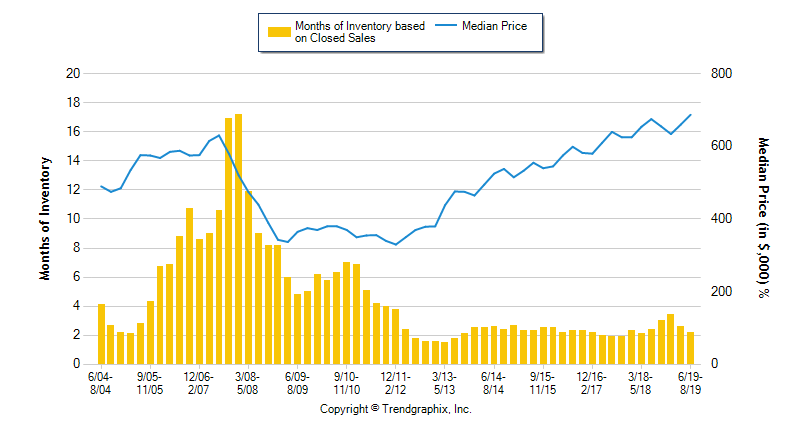
Let’s take a look at the Months Inventory metric going all the way back to the bubble burst and see if we notice anything:
Here’s what I see:
- There was a big run up in Months Inventory prior to the burst in 2007/2008, at least two years before the data was suggesting that something was clearly not right (this alone is enough to warrant concern and an investigation).
- The median price was continuing to go up while the Months Inventory was rising – big red flag. This should ALMOST never happen. Think about it: more listings are coming on the market than the demand can handle, yet prices are rising? HUGE red flag.
- When the correction/burst/crash/whatever you want to call it finally hit, the Months Inventory went through the roof as people desperately tried to sell their properties, and as demand fell through the floor due to the resulting uncertainty, so did the median price.
The clear takeaway is that when you see this number move you should look closer, stable is healthy. If it does move, add in median price and look at the actual number of listings and solds to see what’s happening. If Months Inventory increases consistently and median price continues to rise, or Months Inventory decreases and Median Price falls, be very concerned and start considering your options because there is something fundamentally wrong or there is an outside force working on the market.
This is neither the only reason that the market moves, nor the only way to monitor what is happening, but it is a great metric to watch if you are a homeowner and don’t have time to really “data mine.”
Keep your eyes open and stay tuned for my next piece on momentum and the effects of consumer sentiment.
— JM
*Data via Itech MLS/Trendvision for Single Family Properties in Los Angeles County
John is the Vice President here at JohnHart, and as such is responsible for managing and directing the firm towards obtaining its ultimate goals.
He is also one of our main contributors on the Blog. (please see his profile page on the main site for more information.)
systematic
Total