

“There is no present or future, only the past happening over and over again – now.”
– Eugene O’Neill
Ok, so that quote might be a tad dramatic, but the fact remains that we can often tell a lot about the future simply by looking at the past, the present, and the contrast between the two. When it comes to forecasting the real estate market in Los Angeles County (where our offices are), we are almost entirely dependent upon comparing where we are today to where we were in the past and from that data drawing conclusions regarding where we are headed. Those who follow our real estate blog (The Gazette) will not be surprised to learn that we believe the Months of Inventory statistics to be the single most important tool in determining the direction of the market.
Why are we such staunch supporters of the months of inventory stat? Because in this one figure we are presented with an integer that represents how long the market could sustain the current level of demand if supply was entirely cutoff. Therefore if we take several months’ worth of this statistic and compare them to each other, we have a baseline for the direction that the market is moving. If there is an upward pattern occurring over several months then it is reasonable to assume that prices will be decreasing as either demand is decreasing or supply is increasing (both of which have a negative impact on house values).
This being said, for our Fall Forecast we wanted to go one step further to ensure the absolute accuracy of our advice, so we have incorporated some supporting evidence from a couple other reputable sources.
Let’s jump right in!
Below we have the month’s inventory chart going back to last June, and while it may look like a giant mess, if you look at the data points for 8/2013 and compare them to 8/2014 you will find that aside from La Canada every other city has experienced an increase in this KPI (key performance indicator).

While we may be able to see that the market is generally less strong than it was at this same time last year, the next question that logically comes to pass is “What caused the uptick in month’s inventory?”
To answer that question we need to look at the change in properties on the market and the change in properties sold year over year. The table below represents the change in number of active properties on 8/31/2014 and on 8/31/2013, alongside the change in sold properties during both of those months.
Example: “Glendale | 8 | -42” means that there were 8 more active properties on the market on 8/31/2014 than there were on 8/31/2013, and 42 less properties sold in August ’14 than in August ’13.
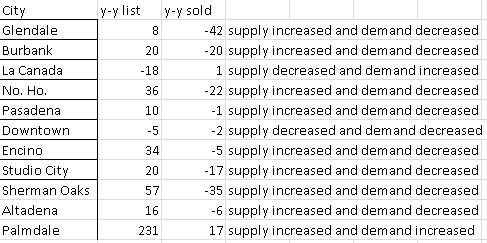
Looking at that table we can see that the common denominator is an increase in listings and a decrease in sales year over year. There are three anomalies – the first being La Canada which we have already seen doesn’t fit the pattern of an increase in month’s inventory year over year, the second is DTLA where we can see that there has been a decrease in listings AND sales, and lastly in Palmdale where there has been an increase in sales but a MASSIVE increase in new listings.
At this point we can pretty easily draw the conclusion, from our months of inventory and listing/sold data, that there is a pretty widespread increase in supply and decrease in demand going on throughout Los Angeles County and a huge increase in supply in Palmdale which is outpacing their small increase in demand.
Based off this information it is safe to say that we believe the market is incurring an influx in listings and that it is poised for a pull back as we move into what is considered the slow season in real estate: Fall.
However, we did some more digging to find another KPI that supports our conclusion about where the market is headed, and what we found is pretty profound. According to the Mortgage Bankers Association, as of July we were sitting on a decrease in the unadjusted purchase index of 16% year-over-year!1 This index measures the number of new purchase loan applications, which is a very strong metric for determining buyers’ demand. Furthermore, according to a press release by the MBA on 8/13/2014, interest rates for most loan products have either decreased or remained stable as of late – leading us to believe that the pull back in loan applications is not a result of “external factors” such as interest rate risk, but instead is directly correlated to the price of property and the buyer’s assessment of value.2
In summation, we believe that the increase in month’s inventory, the apparent increase in supply and decrease in demand (or outpacing of supply relative to demand in Palmdale’s case), along with the decrease in new purchase applications, is a strong indication that we are positioned to see a sizable pullback in property prices as we move into Fall!
-HK
external references:
1 – “http://finance.yahoo.com/news/mortgage-interest-rates-continue-decline-122022929.html”
2 – “http://www.mbaa.org/NewsandMedia/PressCenter/89158.htm”
After working with, and for, many different real estate firms, it became apparent to Harout that there was a major disconnect between what consumers needed/wanted and the service that was being provided to them. It was upon this realization that Harout founded and opened JohnHart Real Estate; and as the CEO/Principal Broker he has continued to break from the norm and redefine real estate with an insatiable appetite to give his clients the service and attention they deserve.
Interesting, I’m wonder the information on supply. What was the numbers from all Standard listing or a mixer including distress property.
Because if there is rolling back in the price of a standard listing. Usually we see an increase from the other types of listing saying distress listing. This keeps the market balance so it doesn’t get out of whack and hurt the economy.
Then comes the losing of mortgages requirement to keep the home price from rolling back to far to fast.
It will be interesting future.
Absolutely James! But you do have to consider that distressed properties are discounted which in turn can also be detrimental to the home prices of surrounding properties. Loosening of mortgage requirements would absolutely help, but we need to remember that we went too loose back in the 2000’s which drove prices to unhealthy levels. I personally see the pull back in prices (which is coming) as more of a return to normalcy from the over-inflated place that we are currently at.
I completely agree that the future is going to be interesting, and as always your feedback is greatly appreciated!
-John
And I believe the entire, very strange, market is tied to the horrible economy that we have been experiencing over the last eight years. We are given bogus employment figures, happy face spin on the economy in general and , oh by the way, has anyone noticed that gas prices are percolating down, just in time for the mid-terms.
I personally believe that real estate will continue to fluctuate (as it always has) and that foreign money will, in the long run, continue to keep prices climbing in Sunny Southern California.
Great analogy! It is so hard to respond with media at bay and knowledge is king. I too feel that the foreign market will help So. California, but so sad for Veterans and American Dream that we constantly bring outside investors from foreign countries and money allows anyone to come in. What a world
I was curious about pepleos opinion regarding commercial and residential local and national real estate markets and whether it will become more of a (Buyers vs Sellers market) based on (1) the recent US elections, (2) the Jan 5th automatic sequestration budget cut issues and (3) the Europe austerity measures in (Greece, Italy, Spain, Portugal and Ireland)? Also what would be your opinion of the % percentage of change up or down in the price of properties?Very respectfully,RTSent from my iPad