

May is here and it is time for another installment of our Los Angeles Real Estate Market Inventory Report. Each month we construct this report with the intention of providing our agents, peers, and clients, with the information they need to make clear and calculated decisions based off statistical market findings and trends.
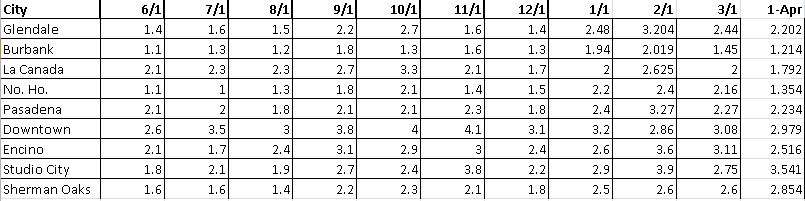
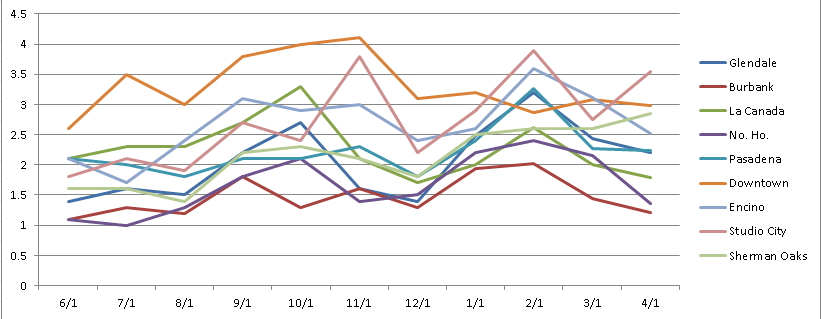
As always, we have included a graph and table showing the current “Months of Inventory” in the Glendale, Burbank, La Canada Flintridge, North Hollywood (No. Ho.), Pasadena, Downtown Los Angeles (DTLA), Encino, and Studio City.
This month we decided to include Sherman Oaks in our study. If there is a city in particular you would like us to include next month, please let us know!
March recap— we observed an increase in both houses for sale (supply) and houses sold (demand) in every market. Though both variables increased, every market showed that the number of houses sold increased more than the number of houses listed—resulting in an increase in demand for the month of March, except in DTLA where supply outpaced demand. After comparing data from March of 2013 with this last March’s data, I was able to conclude that this increase in demand was due to the seasonal nature of buying and selling Real estate (sales increase during the warmer seasons).
Shortly thereafter we had a hunch that even though March’s numbers looked better than February’s, if we compared March to March (year over year) we would find that this year’s selling season is not as hot as the last. Our research confirmed our hunch, and it does appear that the market is not as hot as last year, but with that being said let’s take a look at how April performed in relation to March.
Contrary to March, this past month we observed supply decreasing quicker than demand in every market except that of Sherman Oaks and Studio City—where demand outpaced supply. Though the numbers make it look as if demand has increased, because the inventory figures came down, in actuality what we are seeing is a greater decrease in supply and somewhat stable demand/sales.
Hopefully you enjoyed this update on where we feel the market is heading based off of statistical findings that we compared with last month and last years data as well. We would love to hear any questions, comments, or concerns you may have regarding the current housing market sharing what you think lays ahead!
Contributor, designer & admin for JohnHart Gazette.